
 Today, The Points Guy (TPG) has released its sixth annual Best Airlines Report naming Delta Air Lines the number one airline in America for the fourth year in a row. TPG ranked airlines in the United States from best to worst according to criteria including customer satisfaction, cabin comfort, on-time records, lost luggage data, lounge quality and more. The rankings also reflect a strategic method that evaluates all aspects of a customer’s journey — from ticketing through baggage delivery and even redeeming rewards for future trips
“As travel restrictions were lifted around the world and more people returned to traveling, airlines faced a mountain of challenges this year from labor shortages to unfortunate delays making it a difficult year for air travel,” said Brian Kelly, Founder of The Points Guy. “In the face of these challenges, our team has worked tirelessly to create this invaluable resource that will help travelers make educated decisions when booking their next domestic getaway.”
Southwest Airlines took the number two spot, with United, American, and Alaska rounding out the top five rankings. By contrast, Spirit, Allegiant, and Frontier were the lowest ranked airlines over the last year, with Spirit dropping from 8th place in 2021 to 10th place this year.
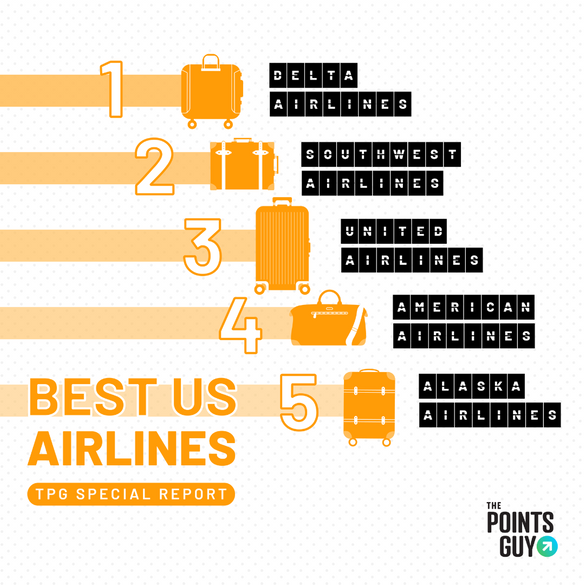
Best Airlines Report for 2022 rankings are highlighted below:
- Delta Air Lines
- Southwest Airlines
- United Airlines
- American Airlines
- Alaska Airlines
- Hawaiian Airlines
- JetBlue Airways
- Frontier Airlines
- Allegiant Air
- Spirit Airlines
Additional takeaways include:
- Delta comes out on top again: Named the winner for the fourth year in a row, Delta boasts an extensive network of lounges, impressive customer satisfaction feedback, and fewer involuntary bumps than its competitors. Delta saw the fewest customer complaints this year with just 1.25 complaints for every 100,000 passengers. They also only bumped two passengers out of more than 127 million Delta flyers in 2021, which was impressive given the state of the airline industry overall.
- Hawaiian Airlines ranks highest in reliability: For the second straight year, Hawaiian Airlines came out on top in terms of reliability with the lowest percentage of delays and cancellations. Over 90% of Hawaiian’s flights arrived on time (within 15 minutes of the scheduled arrival time), and just 264 of the airline’s 60,000+ flights were canceled.
- Southwest wins for affordable fares and widespread network Southwest Airlines took the top spot in the cost & reach category, which measures how vast a carrier’s route network is combined with how much it costs consumers to fly the carrier. While Southwest doesn’t serve as many destinations as some other U.S. airlines, its airfares were notably more affordable than the three legacy airlines (American, Delta, United) — and Southwest charged the fewest ancillary fees for checked bags and ticket changes or cancellations.
- United earns top marks for frequent flyers: United received the highest score in the frequent-flyer category thanks to a broad portfolio of cobranded credit cards plus the highest number of airline partners for earning and redeeming MileagePlus miles.
Report methodology:
This year TPG took into consideration reliability, experience, loyalty and cost & reach for each airline. TPG also examined data from the U.S. Department of Transportation (D.O.T.), including the number of passenger complaints filed against each airline with the D.O.T., as well as the number of reports of lost luggage each airline had. Additionally, in consulting the airlines’ financials and combing through publicly available fleet data, the experts at TPG were able to factor all those elements — and more — into the rankings for 2022’s best airlines report.
For all criteria, the raw scores from the data were converted into a scaled score from 0 to 10 and then weighted using the following percentages to arrive at the final score. This ensured that the calculation for each airline’s score was made relative to the performance of others — as opposed to a simple ranking system that wouldn’t accurately capture these differences.
The full list of factors and weighting was as follows:
- Reliability (30%)
- Timeliness (using data on delayed flights from the D.O.T.)
- Cancellations (using data on canceled flights from the D.O.T.)
- Involuntary bumps (using data on involuntary denied boardings from the D.O.T.)
- Mishandled baggage (using data on mishandled baggage from the D.O.T.)
- Mishandled wheelchairs/scooters (using data on mishandled baggage from the D.O.T.)
- Experience (25%)
- Cabin features (using data from SeatGuru and inflight amenity offerings from each carrier’s website)
- Lounges (using numerical data on the number of lounges, number of airports and price of membership for each applicable lounge network)
- Family (using a 0-to-5 score based on boarding, perks and food/entertainment on board)
- Customer satisfaction (using data on customer complaints from the D.O.T.)
- Costs and Reach (20%)
- Route network (using the monthly average of domestic cities served by each airline from the D.O.T.)
- Affordability (using financial data from the Bureau of Transportation Statistics (B.T.S.))
- Bag/change fees (using financial data from the B.T.S.)
- Loyalty (25%)
- Frequent flyer program (using data from our monthly valuations, elite status reports, and each carrier’s website)
- Award availability (using real-time award inventory for popular domestic routes across three distinct time periods)


