
The exhibition world’s centre of gravity is shifting east, with new UFI research revealing a landmark lead for Asia-Pacific and a global building boom that could reshape the business events industry.
The world’s exhibition industry has a new heavyweight champion, and Europe may need to loosen its grip on the ceremonial ribbon-cutting scissors.
Asia-Pacific has overtaken Europe for the first time in the number of mega exhibition venues, according to UFI’s 2026 World Map of Exhibition Venues, the Global Association of the Exhibition Industry. The region now boasts 41 exhibition centres with at least 100,000 square metres of gross indoor space, compared with Europe’s 38.
It is a narrow lead, certainly. But in an industry where cities spend years planning exhibition halls and decades paying for them, three venues can signal a significant shift.
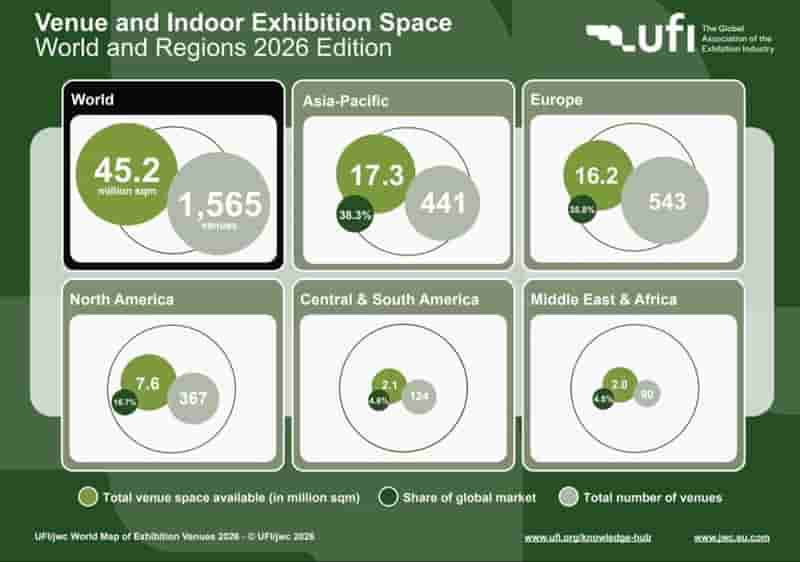
The report, released on 13 October 2026 and produced by consultancy jwc, charts exhibition infrastructure as at 31 December 2025. It identifies 1,565 venues worldwide, each with at least 5,000 square metres of gross indoor exhibition space. Together, they provide 45.2 million square metres of capacity.
That’s 35 more venues and about 900,000 additional square metres than the previous edition. It is impressive real estate, although nobody should confuse more floor space with a guaranteed queue at the registration desk.
Asia-Pacific takes the biggest slice
Asia-Pacific accounts for 38.3% of global indoor exhibition capacity, or about 17.3 million square metres. Europe holds 35.8%, leaving the Asia-Pacific region 2.5 percentage points ahead, while North America accounts for 16.7%.
The figures tell a larger story than who owns the biggest halls. Major exhibitions bring buyers, suppliers, executives and trade delegations together. When those visitors travel, accommodation providers, airlines, transport operators, and local hospitality businesses benefit.
For destinations competing to secure international trade fairs, suitable exhibition space is therefore more than an architectural talking point. It is part of the infrastructure required to bid for, attract and deliver major business events.
UFI chief executive Chris Skeith OBE puts the long-term case plainly:
“Exhibition venues are long-term investments in economic infrastructure.”
That investment can open doors for event organisers seeking room to grow, but it doesn’t automatically translate into fully booked hotels or a stronger visitor economy. International access, event calendars, service quality and destination appeal still matter.
China leads the charge, and Guangzhou goes enormous
The country rankings underline the scale of Asia’s advantage. China alone accounts for 30.7% of global indoor exhibition capacity, comfortably ahead of the United States (13.9%) and Germany (7.0%).
Add Italy and France, and those five countries collectively represent almost 63% of the world’s surveyed exhibition space. Each of the seven national markets offers more than one million square metres.
For sheer size, the Canton Fair Complex in Guangzhou remains the world’s largest exhibition venue, with a reported 504,000 square metres of gross indoor exhibition space.
That is a remarkable amount of room for business cards, product launches and the occasional delegate determined to find the coffee station without consulting a map.
The average Asia-Pacific venue is also considerably larger than its European counterpart: 39,238 square metres versus 29,802. That size difference may appeal to organisers of large manufacturing, technology and industrial exhibitions, although the right choice depends on what each event actually needs.
Bigger is not necessarily better
The report contains a welcome reminder for governments tempted to judge success by the length of an exhibition hall.
Globally, 62% of surveyed venues have less than 20,000 square metres of indoor exhibition space. Another 33% fall between 20,000 and 99,999 square metres, while just 5% 84 venues reach at least 100,000 square metres.
In other words, most exhibition business does not require a building the size of a small suburb. Well-designed, well-connected venues with the right technical facilities can be far more useful than an oversized complex struggling to fill its calendar.
Jochen Witt, president and chief executive of jwc GmbH, makes the distinction neatly:
“The headline numbers are about size, but the more important story is fit.”
His warning is timely. The commercial question for planners is not simply how much space they can build, but whether it suits the exhibitions a destination can realistically win and support.
New markets want a place at the table
Asia-Pacific and Europe may dominate the headlines, but growth isn’t confined to established exhibition capitals.
Central and South America account for 4.8% of global capacity, while the Middle East and Africa hold 4.5%. Together, their share has climbed from 8.4% to 9.3% in a year.
These regions offer another competitive dimension for organisers considering where to expand. Still, the figures measure available facilities, not a sudden transfer of exhibition bookings from one continent to another.
The average venue in Central and South America offers 17,327 square metres, and the region remains the only one of the five surveyed without a venue reaching the 100,000-square-metre threshold.
The study also provides detailed profiles of 22 country and regional markets with more than 300,000 square metres of indoor exhibition space. They include major exhibition economies such as China, Germany, the United States and Japan, alongside Saudi Arabia, the United Arab Emirates, India and Brazil.
What this means for Australian travel and events
For Australia’s business events sector, the lesson is strategic, not alarmist. The global race for exhibition capacity is intensifying, especially across Asia-Pacific, but sheer square metres do not determine the winner of a conference or trade-show bid.
Australian destinations and event operators compete on a broader proposition: accessibility, accommodation, professional expertise, delegate experience, industry connections and the quality of the event itself.
Airlines, hotels and destination marketers should nevertheless pay attention to where new exhibition infrastructure is emerging. Venue investment can create opportunities for future exhibitions and associated travel demand, provided organisers can turn that potential into confirmed events.
Another caution: the UFI census counts gross indoor exhibition space at eligible venues. It does not rank the countries by visitor numbers, revenue, event quality or economic return. Those questions require additional evidence.
The bigger takeaway is difficult to ignore. Exhibition infrastructure is no longer as firmly concentrated in its traditional strongholds. Asia-Pacific has gained the mega-venue lead, other regions are enlarging their footprint, and international organisers have more options than before.
Europe remains a formidable player. But as the 2026 figures show, the next great trade-show opportunity may be found a little further east.
The complete UFI World Map of Exhibition Venues is available free from UFI’s Knowledge Hub and through jwc.
By: Bridget Gomez – © 2026.
Read Time: 6 minutes.
Author Bio:
 Bridget has never been built for stillness. Of Portuguese heritage, she began as a nurse, tending veterans at the Repatriation Hospital and listening to stories as colourful as the life she had yet to live. It was worthy, steady work, but wanderlust, as always, proved louder than routine.
So, she traded starch for a backpack and disappeared for a year, chasing trains, sunsets and the occasional regrettable glass of wine. She wrote everything down: the dust, the laughter, the missteps, the magic. Those notebooks became a travel blog, then a habit, then a calling.
Eventually she found Stephen’s EGT Media, or perhaps it found her.
Today Bridget writes with heart, humour and a dash of mischief, still travelling, just now with words.